Back to Assignments Page |
Module 2 - Chapter Five
Opinion and Participation: Thinking and Acting in Politics
Dye Textbook: Overview |
Dye Textbook - online assignments There are three assignments for each chapter - check within WebCT and on the assignments page. Each assignment should be completed by Thursday at 7:30 p.m. each week. |
Public opinion touches one of the two key dimensions of democracy: the consent of the people. (The other dimension is the rule of law, including the respect of the rights of individuals). Thus, it is not surprising that over the last few decades, an increasing amount of attention has been placed on public opinion research – surveys/polls – as a means of trying to better understand what the people want. Obviously, if politicians want to "do the people’s will" they must have some means for assessing exactly what the people want.
There are a few key points to recall when comparing the "will of the people" and the actions of government, even in a democracy.
The first of these is: Government does NOT always do what the people want!
Now many of you will surely say "DUH" and think did I really need this course!
Let’s first review some instances in which policy has not conformed to apparent public opinion:
1. Balanced budget amendment - public supported, govt. slow to react, never passed by Congress2. Opposition to busing - public opposes, govt. goes forward
3. Support for Equal Rights Amendment - public supports, but not enough legislatures pass
4. Term Limits: favored in many states, but no amendment has made it out of Congress, Supreme Court says "unconstitutional"
5. US intervention in Haiti: Clinton forces changes through threat of military action, sends security forces
6. US involvement in Iraq – President Bush pursues escalation despite public opposition
7. Clinton impeachment proceedings - Not popular with public, but Republican Congress insists
These examples involve a range of policy measures – but the common characteristic is that government officials decided to carry on or oppose the measure despite what polls were telling them.
Naturally, you are wondering "what kind of democracy have we got" if the will of the people isn’t being followed?
This leads us to the second major point:
Calculations made by government involve more than the likely effect of a policy on public opinion.
Politicians and other government officials are balancing public opinion with the following:
Think about the role of the Supreme Court – that may overrule Congressional actions through its power of "judicial review." Obviously the busing issue was a method approved by the Supreme Court to deal with the elimination of "separate but equal" schooling. Clearly busing was not a popular method, as any poll would have shown. But to enforce the rule of law and its interpretation of the Constitution, the Supreme Court went against public opinion to ensure "equality of opportunity." This will be further reviewed in chapter 13.
2. Special Interests vs. "publics"
The public’s opinion is organized mainly through surveys and elections: these tell us in a general way what percentages of the people tend to want, e.g., lower taxes vs. more or better services. But the problem is that lots of things go on in legislatures that are not general but in fact quite particular. They affect specific states, communities, even certain stretches of road. The public as a whole is rarely organized to comment on the specifics of proposed legislation. However, organized interest groups are ready to fill in the details. They typically have highly specialized knowledge about an issue. They can tell politicians quite a bit about the likely impact a bill might have on business, consumers, the environment, even foreign relations. Thus, politicians may end up listening to these interest groups and seem to ignore the will of the "majority." Interest groups are covered in chapter nine.
3. Government listens more to elite views
Elites are those who hold leadership positions in business, politics, the civil service, or among other organized interest groups. They have a disproportionate amount of information, experience, and resources to deal with issues. Politicians may go to them often for their opinions – just like they rely on interest groups in general. These are individuals who we might consider "insiders;" they work in large corporations, in policy think tanks, or at the upper levels of the civil service. They might even be connected to trade unions, consumer groups, or be environmental activists. What they are not is "the general public."
4. Limits on effectiveness of opinion polling
While constitutional checks and the role of organized interest groups and elites limit the responsiveness to known public opinion, what must also be admitted is that there are important limits to what polling can get out of the public.
Public Ignorance
Look at page 138 of your Dye textbook. Figure 5-1 shows the results of asking citizens various questions about the US political system. This measures the public's cognitions about the political system – what they really know about it.
What we find out is that many people don’t know that there are two US Senators from their state (half as many again could name them – can you?). The situation gets worse when we look at certain offices and processes at the state or local level (only 20% could name their state senator – can you?).
Thus, if the public is not well informed about basic institutions and leaders, how well informed is it about important issues? How much of an argument could the "typical citizen" make about the pros/con of US policy in Iraq? Or term limits? Or the ideal size of any proposed tax cut?
Thus, when the "public" is asked "do you favor" kinds of questions about certain policies, survey specialists know that many of those asked really have "non-attitudes" – that is, attitudes that didn’t exist prior to the interviewer calling up and posing the question. Non-attitudes are based on "gut-feelings" rather than "informed judgment."
Would you want our government to determine policies on the basis of non-attitudes?
Instability of Public Opinion
Part of the problem of responding to the will of the people is knowing it when you see it. (Please read the "Can we believe the polls" section for some general methodological comments about polling, p. 139).
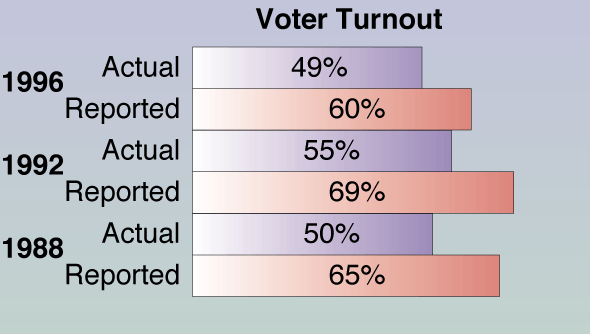
Public opinion often lacks consistency due to the "non-attitudes" issue. "Socially desirable" responses correspond to whatever the respondent thinks the interviewer is likely to want to hear (e.g., thus, politically correct responses get overrated). Dye refers to this as a "halo effect" and is demonstrated in the graph below which shows that respondents anticipate that voting is perceived as a good thing and thus overreport their propensity to engage in this "good thing."
As what is considered socially desirable changes, public opinion may change as well, but without any real depth to the opinions being polled.
Subtle changes in question wording might also make a difference. Obviously, those with integrity in the polling industry know to avoid biased or loaded questions. But what about merely different ways of asking the same thing?
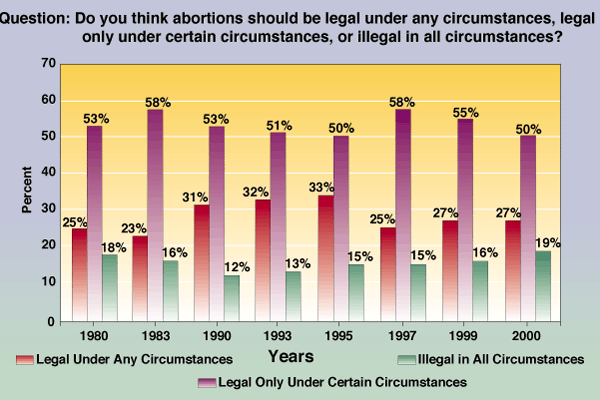
For example, if we wanted to know the public’s views on abortion, we could ask a series of different questions which might affect our conclusions regarding just how much "pro-choice" or "pro-life" sentiment exists in the public. Dye’s pages 142-43 present an interesting overview of polling on this question. Page 143 especially presents a range of opinions, depending on the specific question and how it is worded. The abortion issue is pretty "mature" and thus wording effects are not as great as might be expected.
Other topics might not be as mature, and thus subject to wider variations depending on events of the previous day or week.
The War in Iraq
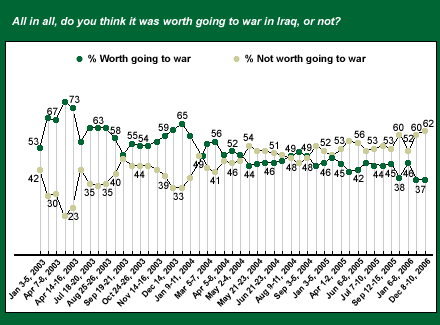
The percentage thinking that "the war in Iraq has been worth the trouble" varied considerably during 2003-2006, probably due to media reported events of the day or week (see Gallup poll results in the graph below). Clearly there are sharp peaks when Iraq holds an election or when Saddam is found, and dips when more troops get killed and civil war seems without end.
Another Gallup question:
Which comes closest to your view about the war with Iraq – [ROTATED: you are certain that the U.S. will win, you think it is likely that the U.S. will win, but you are not certain, you think it is unlikely that the U.S. will win, but you are not certain, (or) you are certain that the U.S. will NOT win]?
Certain will win% Likely but not certain% Unlikely but not certain% Certain will not win% No opinion %
2007 Jan 12-14 17 30 27 22 4 2007 Jan 5-7 16 34 28 18 4 2006 Mar 10-12 22 32 25 16 6 2003 Apr 5 ^ 79 17 1 -- 3 2003 Mar 29-30 69 25 3 1 2 As you can see, there was a sharp drop in confidence about the outcome of the war in Iraq from the time when the war first started in March 2004 to January 2007, when less than a majority felt that it was at least likely that the US would win the war. This again points to the volatility of public opinion, shaped as it is by events, news reporting and actual experiences.
Clinton's Affair
It might be interesting to have polled the public prior to Clinton's affair with Monica Lewinsky to see how tolerant the public would have been of "a president found to have had an adulterous affair while in office." Could we have anticipated Clinton’s strong job approval, even after being impeached (his cumulative job approval rating was 57%, higher than Ronald Reagan's)?
How have public perceptions of the "fairness" with which George W. Bush "won" election in 2000 affected his ability to govern - even after the 2004 election? Could there be an underlying sense that had Bush not "won" the 2000 election, the war in Iraq might have been avoided - an outcome which the polling presented above indicates the public would have favored (in hindsight, naturally).
These are either unknown or incongruous polling findings that make it hard to know what the "people" want...
Party, Ideology and Issue Polarization
The literature on party affiliation or identity assumes that once people have made a choice about a party, they align in predictable ways with the views dominant in each party. However, this assumes that ideology and party are virtually synonymous. We have already discussed the meaning of "Liberal" and "Conservative" while discussing chapter 2, so you already have an image of the differences among those who are strongly ideological. What is less clear is whether party proves to be a clear predictor of the moral acceptability of certain practices. Since we can assume that ideological differences will differentiate the 'extremes' within the parties, it seems likely that something less than complete polarization will characterize differences between partisans.
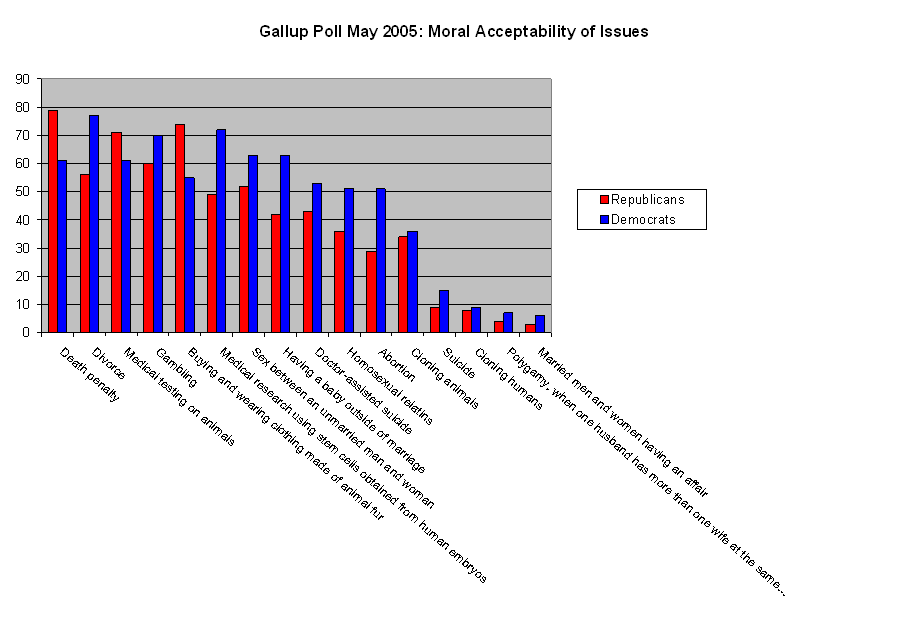
The chart below is based on a Gallup poll taken May 2-5, 2005. It shows the responses to the question "Is practice X morally acceptable to you" as differentiated by party. On the left side are those practices most generally acceptable to all, while to the right are those things least acceptable to all. Thus, 70 percent of the public favors the death penalty, even though there is a 15 point gap (79%, 61%) between Republicans and Democrats. Conversely, only 12 percent of the public finds suicide morally acceptable, even though there are more Democrats (15%) who find it acceptable than Republicans (9%).
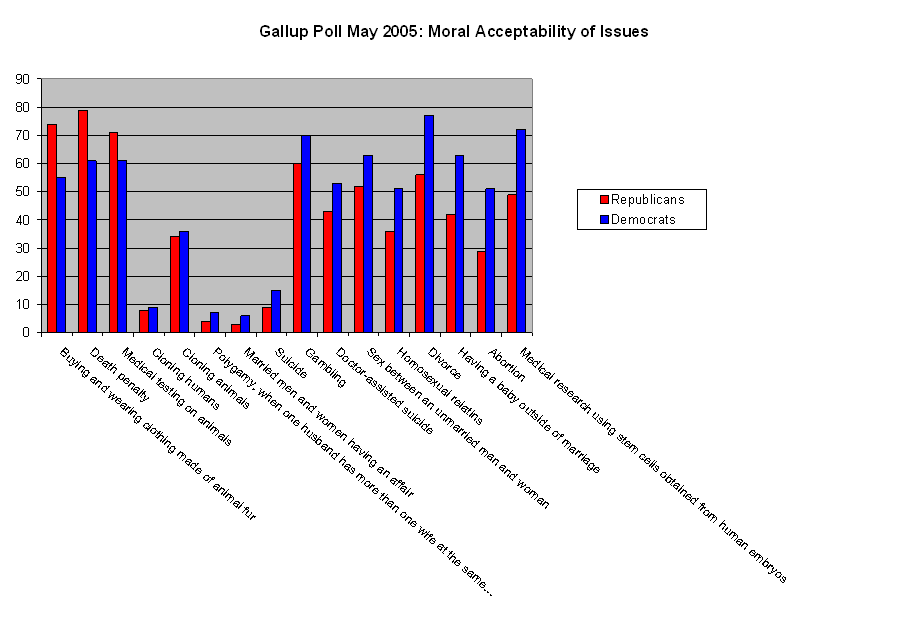
However, when the chart is resorted to emphasize the issues with the greatest differences between the parties, the ideological "hearts" of the parties are better revealed.
In the chart above you can see that there for only three issues do Republicans favor a practice more often that Democrats: animal fur, death penalty and medical testing on animals. For the other 13 issues, Democrats are more tolerant than Republicans, with the greatest differences on divorce, having a baby outside of marriage, abortion and stem cell research. Overall, then, it is possible to see that Democrats are more 'open' to a variety of practices that are on the cultural 'cutting edge' - more liberal in that sense. Republicans are more traditional or conservative, although remember that these charts show that differences on a variety of issues such as divorce, sex between an unmarried man and woman and even stem cell research, around 50 percent or more of Republicans also find such practices to be morally acceptable.
The main point, therefore, is that while it is likely that Republicans are more conservative than Democrats, it is important not to overly exaggerate these differences.
Party and Presidential Job Approval
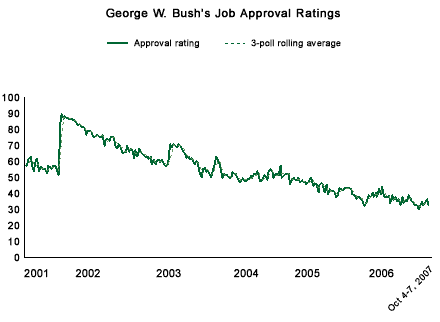
The importance of party identification can also be illustrated by the following graphs, which highlight George W. Bush's Presidential job approval through July 2005. The first graph simply shows the contrast between Bush's highest approval coming in the immediate aftermath of the terrorist attacks of September 11, 2001 and the July 2005 findings.
Graph 1: High/Low Job Approval for George W. Bush
The second graph shows the small "honeymoon" period which Bush received immediately upon reelection, when his "approval" was below above 50%. He expected a 9/11 based "rally effect" which lasted around 18 months, temporarily boosted further by the start of the war in Iraq (March 2003). As you can see by February of 2004, the disapproval edged up to around 50%...by the June 2005 poll, 53% disapproved of the job he was doing. As of Feb 8, Gallup reports his job approval score as 37%.
Graph 2: George W. Bush Job Approval 2004-2005
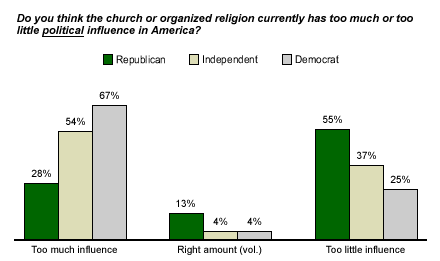
Finally, as we can see in the graphic below (Graph 3), extreme polarization around party identification symbolized the severe partisan divide afflicting the country. Around 90% of Republicans approved of Bush's job, while a similar percentage of Democrats disapproved. The "swing voters" who are independent tended to side with the Democrats, with 58% disapproving of Bush's job as President. As you can see, with such polarization, the great bulk of the public interprets the President's actions through the lens of partisanship.
Graph 3 - Party Identification and Presidential Approval
Historical Look at Presidential Disapproval Ratings
Tuesday, June 28, 2005
by Joseph Carroll (Gallup Organization)
Much of the attention paid to public opinion polls on a president's performance in office focuses on the percentage of Americans who approve of the way that person is handling his job. But what insights can be gained by looking at presidential disapproval ratings?
George W. Bush
The latest CNN/USA Today/Gallup poll, conducted June 24-26, finds that 45% of Americans approve of the way George W. Bush is handling his job as president, while a slim majority, 53%, disapprove. Since he took office, Bush's lowest disapproval ratings occurred in September 2001, a little over a week after the terrorist attacks in New York City and Washington, D.C. A Sept. 21-22 poll found 90% of Americans approving and only 6% disapproving of Bush. In contrast, the current results represent the worst ratings of Bush's presidency. The current approval rating ties Bush's lowest (45% in March 2005), but this poll finds his highest disapproval rating ever.
An analysis of Bush's disapproval ratings on a year-to-year basis shows that just about a quarter of Americans, 24%, disapproved of Bush across 31 polls conducted in 2001. This disapproval average declined by two points in 2002, to 22%. Beginning in 2003, Bush's disapproval average started to increase sharply. About a third of Americans (35%), on average, disapproved of Bush in 2003. This jumped once again in 2004, when 46% of Americans, on average, disapproved. Across the 20 surveys conducted since the start of this year, 47% say they disapprove of Bush -- not much different from what Gallup found last year.
Republicans and Democrats vary significantly in their views of Bush: although the vast majority of Republicans approve of Bush's job performance, there are just as many Democrats who disapprove. The June 24-26 poll finds that 89% of Republicans approve of Bush, while just 10% disapprove. This compares with 11% of Democrats who approve of Bush and 88% who disapprove of him. Among independents, 37% approve and 58% disapprove.
Historical Comparisons
Ever since Gallup first started asking Americans to rate the president in the late 1930s, seven other presidents have experienced a time when a majority of Americans have disapproved of them. Only four presidents never had a disapproval rating over 50%: John F. Kennedy's highest disapproval was 30% about two weeks before his death; Dwight Eisenhower's highest was 36% in March 1958; and both Franklin D. Roosevelt and Gerald Ford scored a 46% disapproval rating as their highest.
- Bill Clinton's highest disapproval rating was 54% in September 1994. In fact, several polls that year found at least 50% of Americans disapproving of Clinton's performance as president.
- In the summer of his re-election bid, 60% of Americans told Gallup they disapproved of the way George H.W. Bush was handling the presidency. Across the 14 polls conducted from May 1992 through October 1992, a majority of Americans expressed disapproval in Bush.
- In January 1983, 56% of Americans said they disapproved of Ronald Reagan. Five polls conducted from December 1982 through February 1983 found at least 50% of Americans disapproving of Reagan.
- Many of the polls conducted in 1979 and 1980 found majority disapproval of Jimmy Carter's performance. His highest disapproval was 59% in June and July 1979.
- Just prior to his resignation as president, 66% of Americans said they disapproved of the way Richard Nixon was handling the presidency.
- In March 1968, Gallup found that 52% of Americans disapproved of Lyndon B. Johnson. Johnson's disapproval ratings were at 50% or higher only four times in his presidency.
- Harry Truman scored the highest disapproval rating in Gallup's history -- 67% -- in January 1952. Truman also scored the lowest approval rating in Gallup's history, 23%, in the same poll.
Socialization
This is a topic reviewed at some length by Dye. Generally it deals with the process by which individuals come to hold political values, beliefs and opinions. The process has many agents: family, school, religious institutions are mentioned, but other entities as well like peer groups, in addition to contextual effects (would you really like to be the only Republican in Baltimore City!).
Moreover, there are generational and life-cycle effects.
Generational effects:
For me, generational effects would include the Vietnam War, Watergate, the various oil crises of the 1970s.
For some of you, generational effects might include the end of the Cold War, the impact of computers and technology upon political communication, and the Monica Lewinsky scandal and your image of what makes for a good President, the controversial Presidential election of 2000, which has made us familiar with "dimpled chads" and "butterfly ballots," and naturally the terrorist attacks of September 2001 and the wars in Afghanistan and Iraq.
Good economic times lead people to be less concerned about unemployment – the generation of the 1990s will perhaps come to expect endless prosperity and have little tolerance for economic downturns; those voting in the 2004 elections were faced with the choice of voting their pocketbooks - and thereby punishing George W. Bush's administration for not meeting expectations generated in the late 1990s - or rallying around the President and the "war on terrorism." Clearly, Bush's reelection was not based on a perception of good economic times (only 34% thought the economy was doing excellent or good at the time of the election)...
By contrast, the generation that experienced the Great Depression of the 1930s tends to be very cautious about good times and prone to expect the worse (talk to your grandparents about their views on the economy and the role of government…).
Life cycle effects:
Life-cycle effects argue that people’s views change depending on their momentary position in life: idealistic when young, tax and education conscious during middle earning years, and then conservative yet social security-loving as they retire.
In the 2004 elections, John Kerry only took a majority of a single age group - those between 18 and 29. Perhaps they were especially concerned about the state of the economy, the possibility of a draft due to the President's inability to quickly terminate the war in Iraq, or they might have been more inclined to support a candidate perceived as "more secular" since that age group had the least religious inclinations of any age group. A life cycle effect would say that this same group will get more religious over time and thus be more conservative in their later years. An alternative argument is that the younger generation has permanently adopted more secular views... Only time will tell which argument is valid.
Other factors:
Naturally, demographic attributes are also often correlated with political attitudes. Gender differences are very well illustrated by Dye on p. 144; racial differences are shown on the next page. Just looking at the charts on these two pages, it seems that gender differences are not as sharp as racial ones.
Moreover, in keeping with the comments made earlier about Presidential job approval, the importance of party identification for understanding people's attitudes on other issues should not be underestimated. For example, in 2004 the Gallup organization conducted a poll about citizens' feelings about the separation of church and state. The graph below shows that there was a very sharp polarization between Democrats (most of whom felt that the religion currently had too much influence in America) and Republicans, a majority of whom thought that it had too little influence.
You should be able to recognize some these socialization differences for multi-choice questions on your next mid-term.
Expansion of the Suffrage
Dye provides an interesting look at the process by which the suffrage was expanded. It is too easy to forget how much of the American public was excluded from voting at various points in history. Property qualifications were gradually eliminated by the Civil War, but gender restrictions (preventing women from voting) did not end until World War I.
The fact that civil rights struggles reached a height in the 1960s shows that the African-Americans did not truly enjoy voting rights and political equality until very recently, despite the passage of the 14th and 15th Amendments after the Civil War.
Young people between the ages of 18 and 21 did not gain the right to vote until passage of the 26th Amendment in 1971, a result of the Vietnam War and the sense that those old enough to go to war should have a say in choosing policy-makers.
Participation
Unfortunately, despite the expansion of the suffrage, the US has not been among world leaders in voting turnout. As Dye points out, rational voters know that the chances for affecting an election are slim for individuals; thus, they turnout based on civic duty and perhaps habit more than anything else. When civic duty ebbs, so does turnout. Some exceptions include situations in which a race seems very close – then rational voters think they might just make a difference. Surely, if voters in Florida had known that a few hundred votes might determine the winning Presidential candidate in 2000, more of them would have gone out and voted...The same might be said of voters in the state of Washington in 2004, whose governor's race was determined by under a couple of hundred votes out of the millions cast.
Other factors like registration obstacles, alienation, the lack of strong political beliefs, the role of the media, the decline of parties, as well as social and economic characteristic are also reviewed in Dye in terms of their effects on turnout.
Note some of the other, nontraditional forms of political expression the Dye book mentioned, such as civil disobedience. To some extent we are stamped by our generation: the 1960s and 1970s was much more of a time when riots and mass protests were a form of political expression. These were less obvious in the 1990s, leaving electoral participation as the most visible means of participation. On exception to this has been with regard to the meetings of the International Monetary Fund (IMF) and/or World Trade Organization (WTO), which has engendered mass demonstrations in various places.
Other traditional means of participation might include partaking in a campaign, writing (emailing) to elected officials, contributing money to a cause, or even just trying to affect the opinions of others about an issue or candidate.
Do you think the war in Iraq was the key issue orienting voters in the 2004 Presidential election? Was the difference between the two major candidates on this issue obvious? How about the 'independent' voters, how did they swing? You might check out some web sites such as www.gallup.com to see what historical information is available.
Try going to the http://cnn.com/ALLPOLITICS/ site for some national events. Local events are covered in several newspapers such as the Annapolis Capital, the Baltimore Sun or the Washington Post.